discretisedfield.plotting.add_colorwheel#
- discretisedfield.plotting.add_colorwheel(ax, width=1, height=1, loc='lower right', **kwargs)#
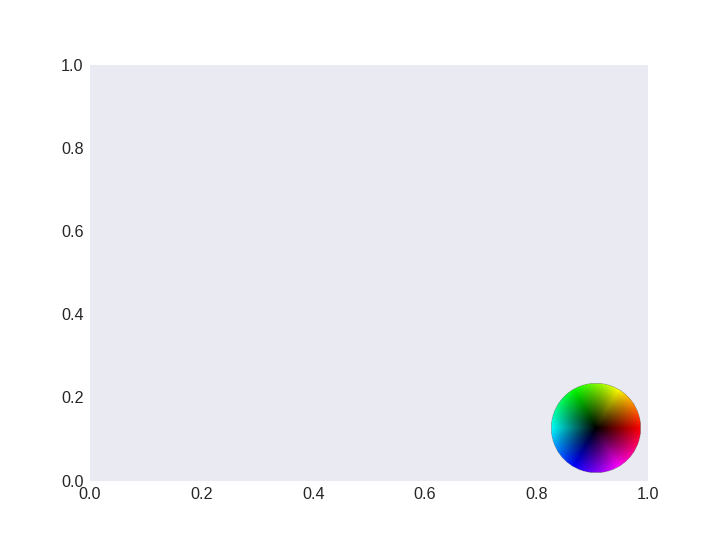
Colorwheel for hsv plots.
Creates colorwheel on new inset axis. See
mpl_toolkits.axes_grid1.inset_locator.inset_axesfor the meaning of the arguments and other possible keyword arguments.Example
1. Adding a colorwheel to an empty axis >>> import discretisedfield.plotting as dfp >>> import matplotlib.pyplot as plt … >>> fig, ax = plt.subplots() # doctest: +SKIP >>> ins_ax = dfp.add_colorwheel(ax) # doctest: +SKIP